
This is our first post in a series of four articles dissecting how to measure greenhouse gas emissions from operating data centers and cloud services. Today’s post explores the drivers behind the emissions of data centers and provides a detailed benchmarking, ranking more than 60 locations around the world in terms of their carbon intensity across major data center providers like AWS, GCP, and Azure.
Check out subsequent posts in this series to learn about A) the role of the big three, namely AWS, Azure, and GCP, B) how to assess emissions from your specific computing activities, including on-prem data centers and hybrid set-ups, and C) how to lower your cloud computing footprint.
In public debate, emissions from cloud computing are often overlooked, despite having gained prominence due to reports about the massive CO2 footprint of popular activities like watching Netflix or trading crypto assets.
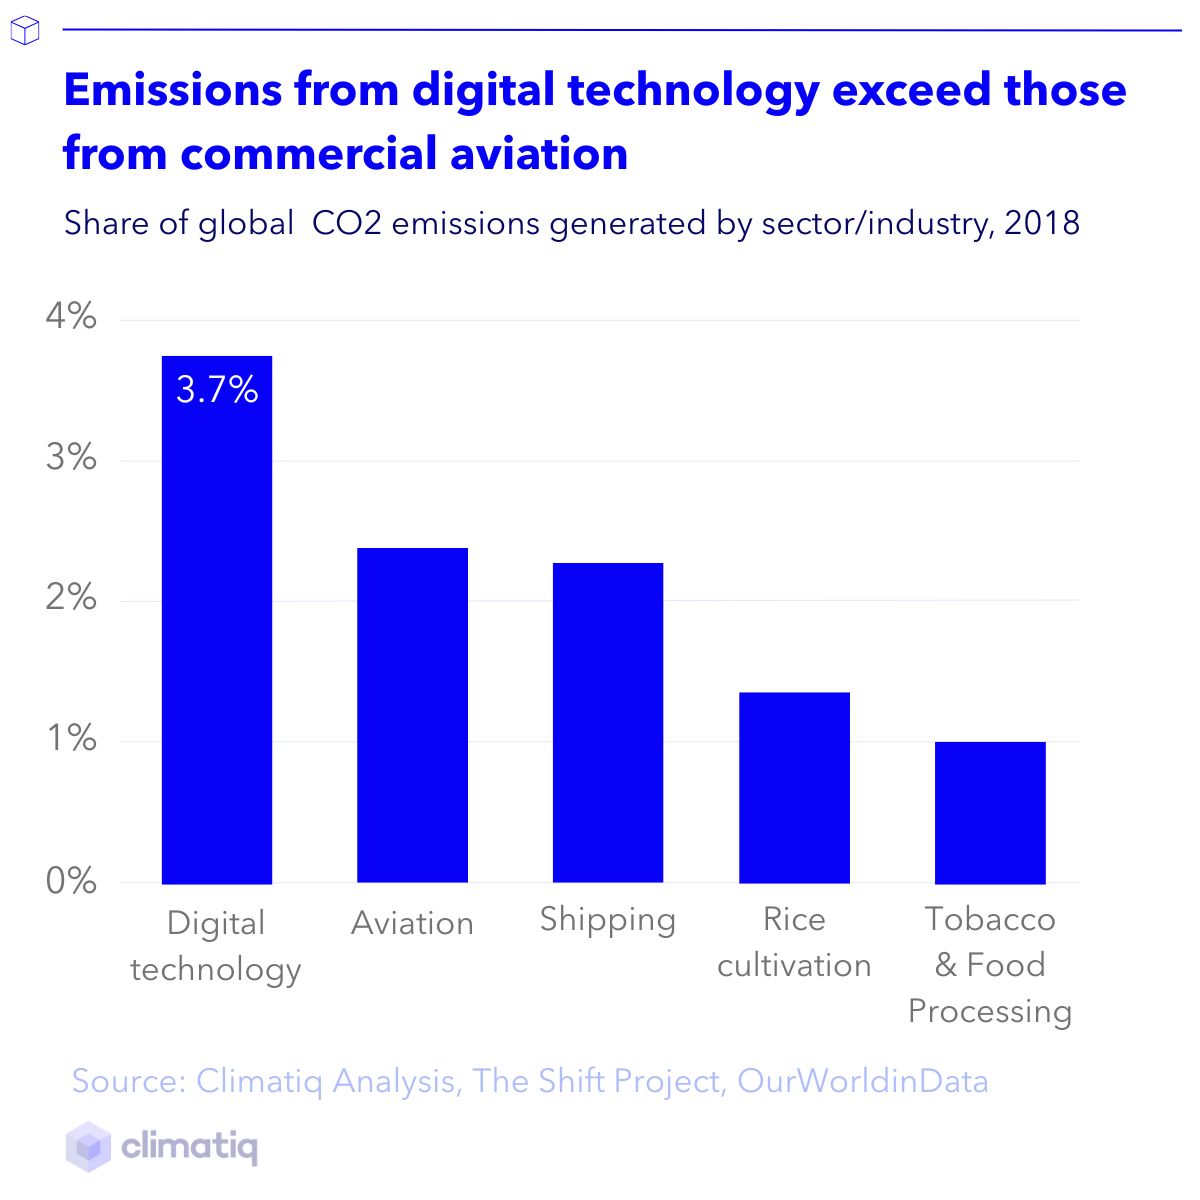
Global emissions from digital technology were placed at 3.7% of total greenhouse gas emissions in 2018. This places emissions from digital technology comfortably above emissions from commercial flights (about 2.4%) and many other activities necessary to fuel our global economy, even at 2018 levels.
Now more than ever, cloud computing providers should therefore take action. However, they often struggle to determine how to lower emissions, because credible emissions data covering their operations are unavailable, inconsistent, or lack transparency.
This is particularly true for AWS but also other hyperscalers such as Azure and Google Cloud, who recently began sharing their cloud calculators with some clients—though not all.
At Climatiq, we are seeing an increased interest from forward-thinking organizations striving to better understand emissions from their computing operations, such as Xero.
To make things clearer, here we will start by explaining the main underlying drivers of computing emissions. Next, we explore tactics to help organizations lower their emissions.
Let’s start with the fundamentals of the drivers of emissions data.
The carbon footprint of a data center is affected by three factors:
All three variables have unique features that need to be considered when performing emissions calculations.
Starting with electricity consumption, a key metric to consider when calculating energy usage is the Power Usage Effectiveness (PUE) value:
Many calculators out there ignore this variable. Climatiq’s cloud computing emission factors take PUE into account when estimating the emissions of cloud services.
Concerning water consumption, it’s important to consider that powering data centers is among the top ten water-consuming activities in the US, according to credible research. However, cloud providers usually do not report water consumption (and corresponding water stress levels)—frightening, to say the least.
Climatiq’s director of science Maryam Arbabzadeh co-authored a paper that calculates the median water footprint of data centers at no less than 0.74 litres per GB of internet use (for networking). This suggests that the impact on water consumption is very relevant and urgently needs to be considered when calculating emissions.
For server lifetime, companies face similar challenges with existing cloud provider reports. Most of them neither share nor consider server lifetimes. However, servers usually get replaced every 3 to 5 years (longer for local data centers), leading to spikes in emissions. These emissions should also be incorporated into calculations.
Generally speaking, hyperscalers and co-located data centers are more efficient (including accounting for water consumption). This is driven by better energy utilization, more efficient cooling systems, and increased workloads per server.
Computing workloads in hyperscale data centers are almost six times more water efficient than internal data centers.

Based on the methodology developed by CCF and using Climatiq’s comprehensive emissions database, we have designed a heatmap to rank data centers across more than 60 locations around the world according to their emission intensity. Locations can be filtered by major cloud providers (AWS vs. GCP vs. Azure) and are ranked by CO2 emissions output per CPU-hour.
We’d love to hear from you if you have any questions regarding our methodology or wish to know more about the data. Please get in touch with us here.


.svg)
