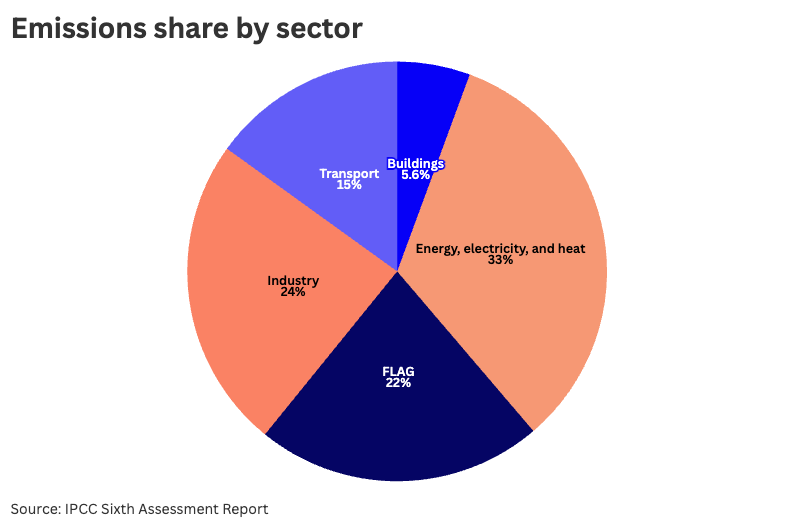
When we think about climate change and greenhouse gases, we tend to think about energy, industry, and transport. But there’s another major source hiding in plain sight: our forests, fields, and food systems. Emissions from these sources make up more than 20% of global emissions, meaning companies can’t afford to overlook them. They are also some of the areas most impacted by climate change.
FLAG refers to Forests, Land, and Agriculture. This term has come into prominence recently thanks to the Science Based Targets Initiative (SBTi), a global body that enables businesses to set emissions reduction targets in line with climate science. There are already a few other acronyms in this space: FLAG combines “Land use, Land-use change, and Forestry (LULUCF)” and “Agriculture”. It’s (almost) equivalent to the Intergovernmental Panel on Climate Change’s (IPCC) “Agriculture, Forestry and Other Land Use (AFOLU)”.
If your business owns land, operates in the land, forestry, or agriculture sectors, or these form a significant part of your supply chain, then this is relevant to you.
The FLAG sector has always been a significant source of emissions and is regularly in the news—think of tropical deforestation, biofuels, and burping cattle.
What has changed is that the Corporate Sustainability Reporting Directive (CSRD) now requires companies to report in line with the GHG Protocol, which has published draft guidance on reporting emissions for the Land sector. The SBTi also requires certain companies to set separate FLAG targets. Combined, the topic of FLAG emissions is becoming increasingly common.
FLAG covers a wide range of goods; the SBTi has identified the most emissions-intensive ones:
Emissions from producing these goods come from physical, chemical, and biological processes:
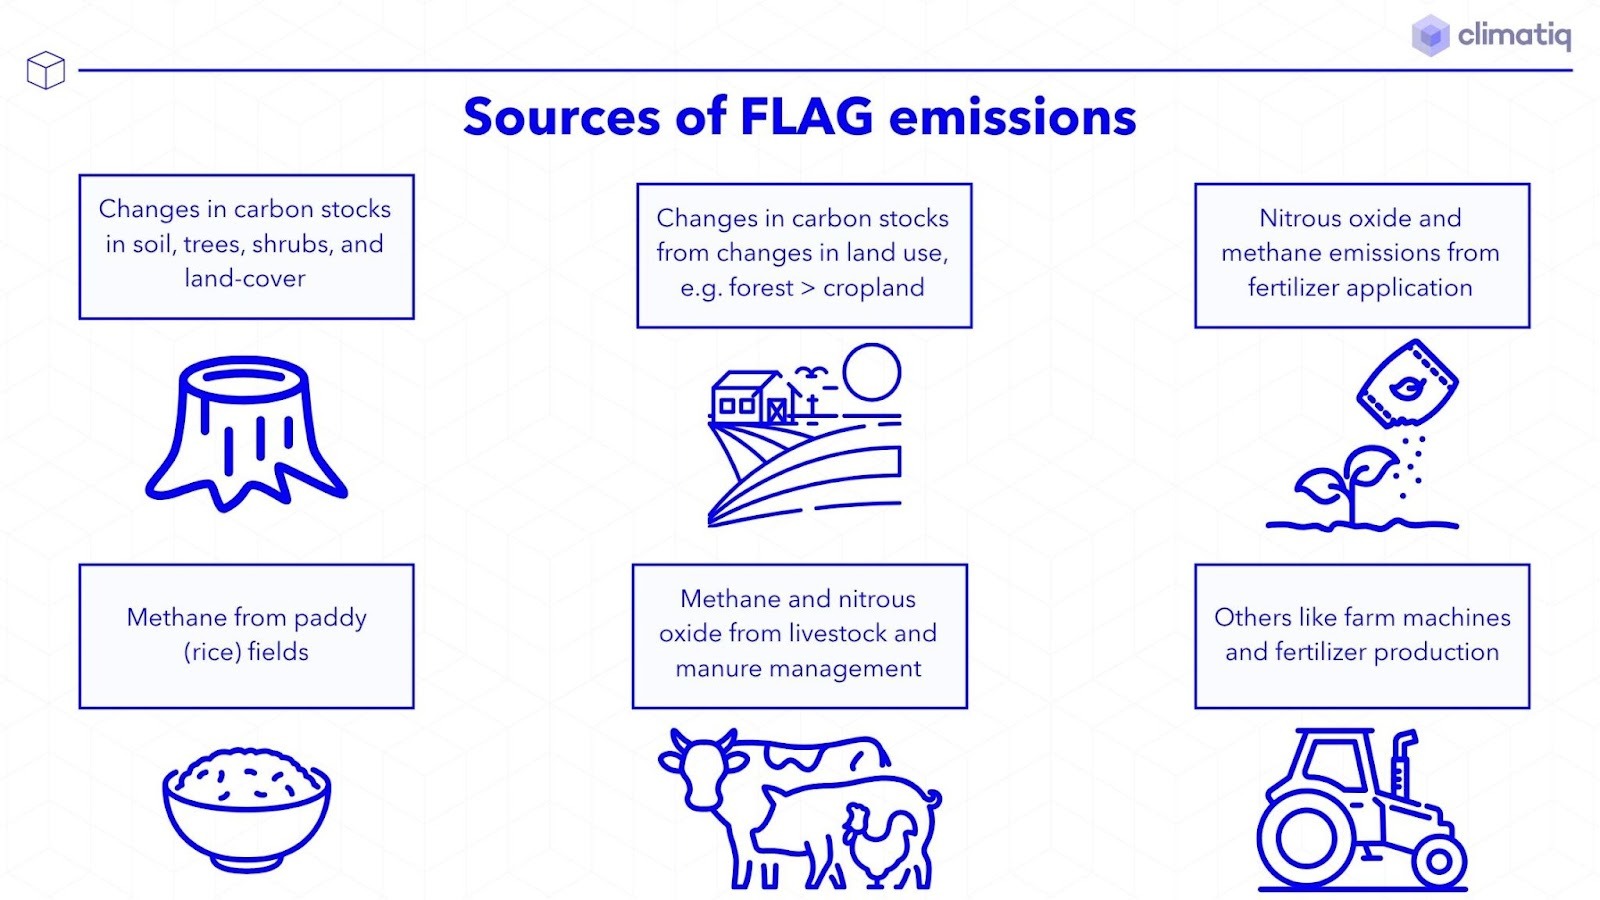
Emissions from burning fossil fuels or producing inputs like fertilizers and machinery are typically counted under other sectors. However, the SBTi has chosen to include some of these emissions within FLAG because they are often built into general emission factors and can’t be easily separated:
It’s more important to include all emissions, even if they can’t be individually separated, than to leave some out in the effort to distinguish them.
Carbon dioxide (and methane) emissions and removals from living organisms (soils, plants, animals) are referred to as “biogenic”, a sub-category within FLAG.
If FLAG emissions are significant for your business, they should already be included in your company’s reported emissions: either in scope 1 (direct) if it owns or operates land, or in scope 3.1 if it buys goods from the FLAG sector. New guidance may mean that you have to estimate them more accurately, or report them separately if your company has land sector activities in its value chain.
For more insights on emissions measurement, see our article on principles to consider in carbon accounting.
The section below summarizes the key points from the main sources of guidance on FLAG, the GHG Protocol (and regulations such as CSRD that depend on it), and the SBTi.
The GHG Protocol’s “Land Sector and Removals Guidance” was released in draft in 2022 and is due to be published towards the end of 2025. Companies with agricultural, forestry, or other land-based value chains are the focus of the guidance. This includes companies that:
The draft GHG Protocol guidance requires companies to report the following emissions categories. These should be included in the appropriate scopes based on who owns or operates the emission sources, scope 1 (owned) or scope 3 (value chain).
Note that while these sources must be included, they need not be calculated and reported individually; they can be combined.
Companies must also report one or more land-tracking metrics on indirect land-use change, land occupation, or carbon opportunity costs. See the draft GHG Protocol guidance for more details.
If your company produces agricultural or other FLAG-related goods then you will need to provide your customers with the emissions data they need for their reports. Your customers are likely to ask for product-level emissions estimates in the form of a Product Carbon Footprint (PCF) or similar. There are standards that govern how to produce these documents.
The PACT Methodology for PCFs offers a way for organizations to exchange PCF data consistently. The latest version (v3) also includes specific guidance on land sector and biogenic emissions and removals.
In the European Union, the detailed requirements for CSRD reporting are covered by the European Sustainability Reporting Standards (ESRS). The key standard for GHG emissions reporting is ESRS E1.
ESRS E1 does not set explicit requirements for FLAG but it does require companies to adhere to the GHG Protocol guidance. There is likely to be sector-specific guidance for the agricultural sector in the future.
As always, the overriding principle of materiality must be applied—companies must report information if it is material (of relevance) to stakeholders. Whether FLAG emissions are material for your company is determined by a materiality assessment, but a quick test would be whether the company meets the requirements for setting a SBTi FLAG target—see below.
ESRS 1 requires separate reporting of biogenic carbon uptake and emissions caused by land use change, land use, and forestry. However, these separate disclosures may be omitted if emissions are not material or if suitable data is not available. In this case, the company must provide a justification for the omission.
The SBTi guidance requires FLAG emissions to be included in the target boundary (the sources of emissions covered by a climate target).
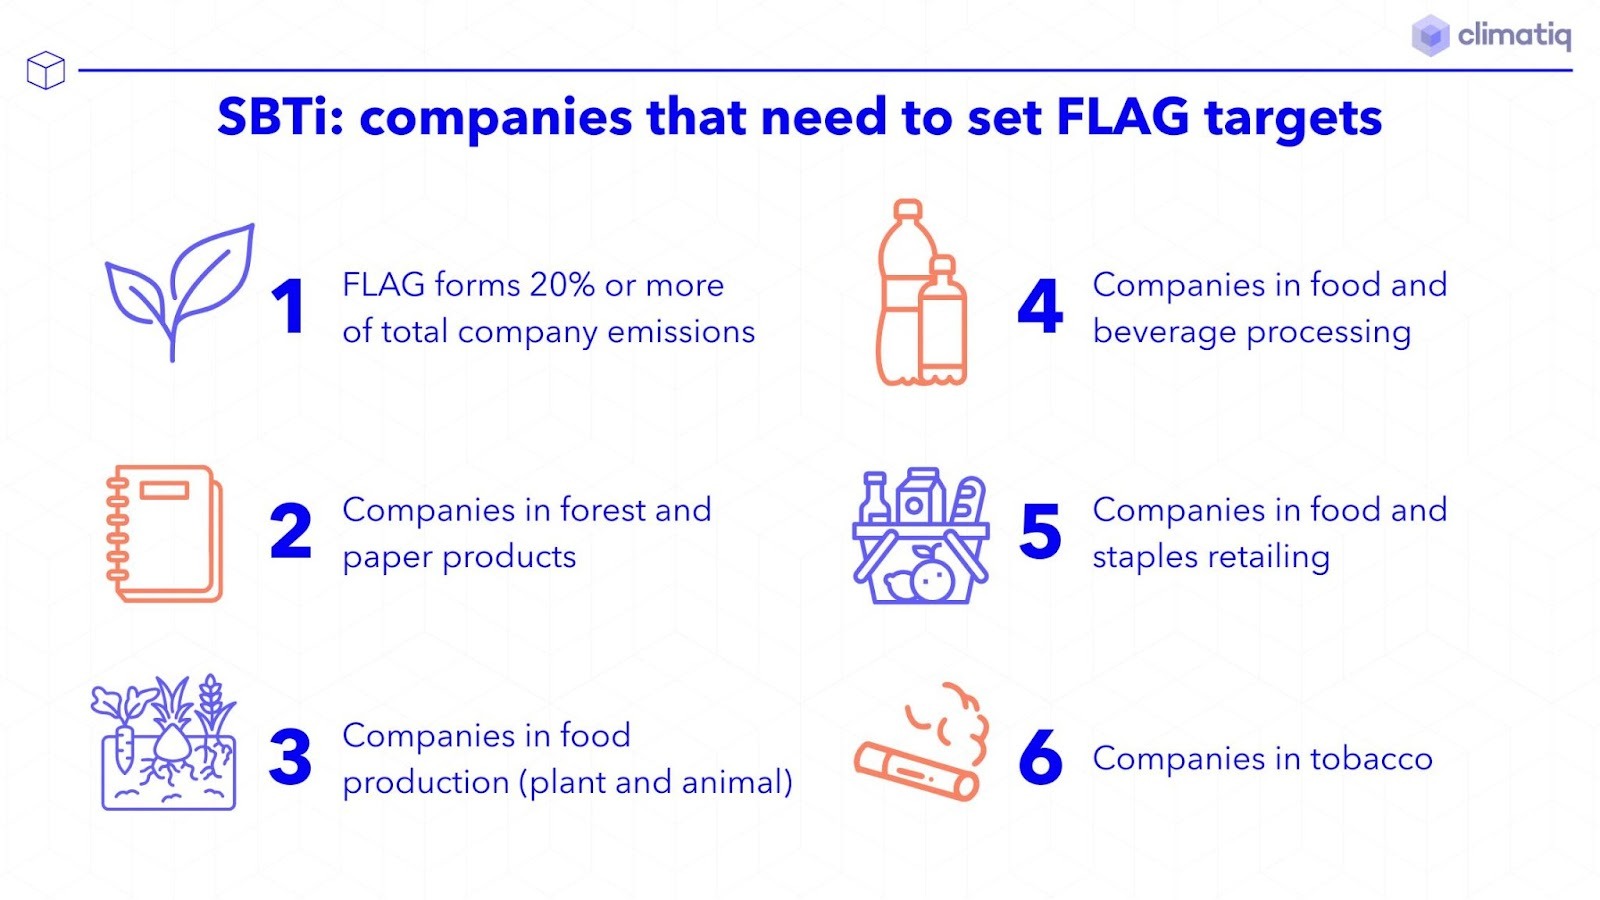
Companies must set a separate FLAG target if FLAG-related emissions form 20% or more of total scope 1, 2, and 3 emissions or if the company operates in any of the following sectors:
SBTi provides a tool for companies to help set targets for key commodities. Targets must cover 95% of scope 1 FLAG emissions and 67% of scope 3 FLAG emissions.
There are three FLAG emissions and removals categories; some examples are included below. Refer to the SBTi for the full guidance.
FLAG activities are some of the oldest on planet earth. Their impact reaches across industries and they lie at the very source of many supply chains. But it’s this complexity, coupled with uncertainty in quantifying emissions from physical, chemical, and biological processes, that makes it difficult to measure the emissions from the FLAG sector, and leaves many companies searching for a simple way to quantify the impact of FLAG on their carbon footprint.
To find out more about calculating company emissions for the FLAG sector, stay tuned for the next article in this series which breaks down how to use Climatiq data to tackle FLAG emissions calculations.


.svg)
